See how many visitors you received each hour
In a previous article we described how visits distribution works on FeelingSurf. In this post we take a closer look at the new website metrics, which let you see how many visits your websites received every hour.
Improved website metrics
Viewing the metrics of a website is easy. From your dashboard, open Your websites and click the number in the Visits column for any website to open its metrics.
A window opens with two tabs and a chart:
- The first tab shows how many visits were sent to the website each day over the previous 7 days.
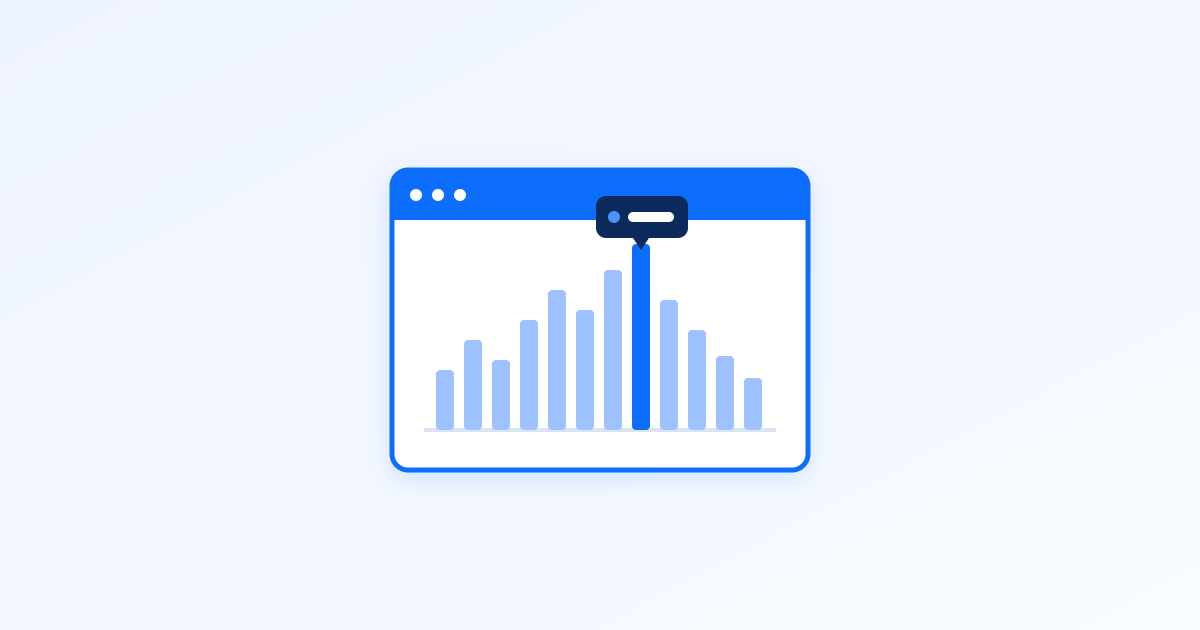
- The second tab — the new one — shows how many visits were delivered each hour over the last 24 hours.
Hover or click a point on the hourly chart to see the number of visits for that hour, expressed in your time zone. If your time zone isn’t correct, adjust it from the timezone label shown on the chart (e.g. UTC).
Viewing metrics for multiple websites
You can also display metrics for several websites at once: select multiple websites, then click the chart icon in the toolbar above your websites list. The chart then overlays the selected websites’ metrics together.
Final notes
Combined with all the traffic options available on FeelingSurf, these metrics give you instant feedback on the traffic delivered to your websites. If needed, adjust your hourly or daily visit limits to match your traffic requirements.
You’ll find these metrics directly in your FeelingSurf account. Don’t have an account yet? Join our traffic exchange today and get 100 free visits.